
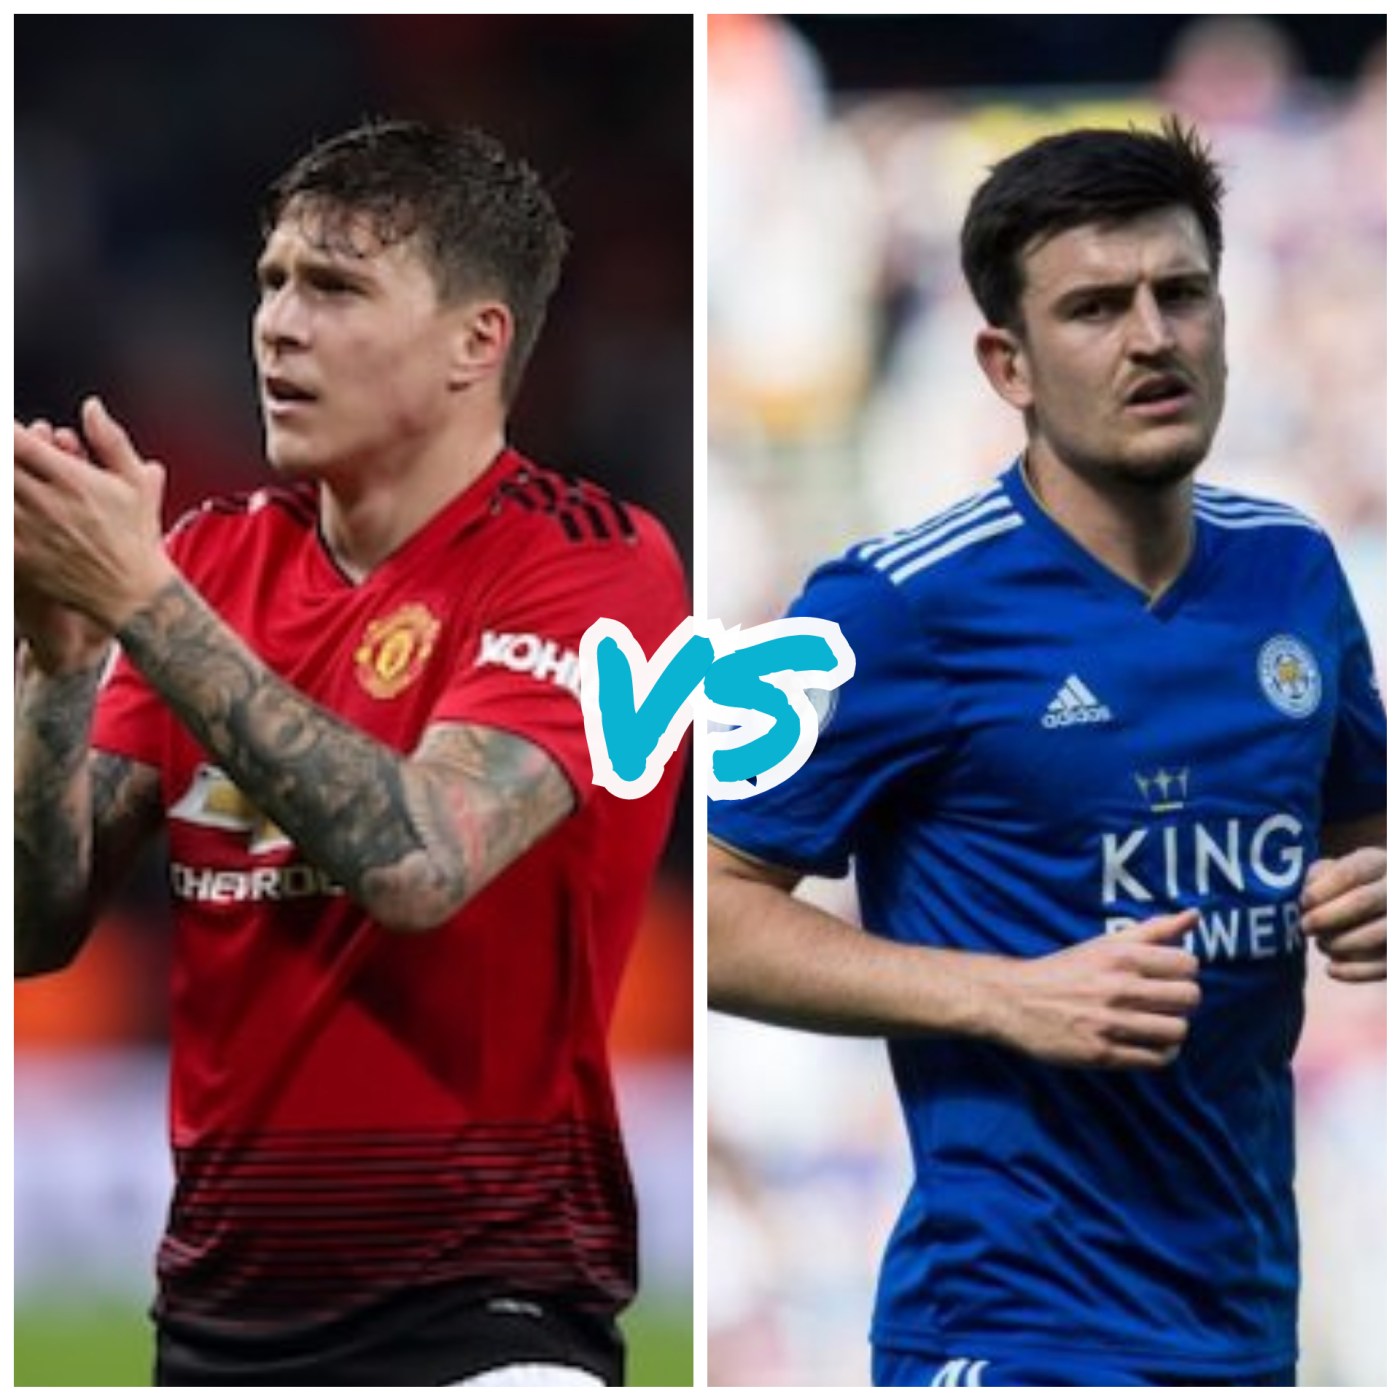
Victor and Harry. Sounds like the title for a comedic british gangster film. Well I can assure you it isn’t. Who did it better? Let’s have a look.
OVERVIEW
Lindelöf |
Maguire |
|
| Appearances | 30 | 31 |
| Minutes Played | 2,602 | 2,599 |
| Matches Started | 29 | 31 |
| Subbed on | 1 | 0 |
| Subbed off | 2 | 2 |
| Distance Run (km) | 266.50 | 271.61 |
| Distance Run per Match (km) | 8.88 | 8.76 |
| Yellow Cards | 1 | 6 |
| Red Cards | 0 | 1 |
| SCORE | 5 | 3 |
Victor played a game less than Harry (30 to 31) and ridiculously only 3 minutes more (2,602 to 2,599), so both spent an equal amount of time on the pitch this season. Maguire covered more ground overall but Lindelöf had a slightly better distance covered per game average (8.88km). Maguire had a worse disciplinary record with 6 yellows and 1 red. Lindelöf only received 1 yellow card over 30 games the entire season. Quite remarkable for a CB. Nothing to choose from between the two.
DEFENDING
Lindelöf |
Maguire |
|
| Clean Sheets | 6 | 6 |
| Goals conceded | 40 | 40 |
| Blocks | 12 | 18 |
| Interceptions | 24 | 37 |
| Tackles | 40 | 31 |
| Tackles Won | 27 | 17 |
| Last Man Tackles | 1 | 2 |
| Clearances | 118 | 152 |
| Headed Clearances | 63 | 77 |
| Aerial Battles Won | 69 | 118 |
| Fouls | 19 | 20 |
| Own Goals | 1 | 0 |
| Errors leading to Goal | 0 | 1 |
| Penalties Conceded | 0 | 0 |
| SCORE | 4 | 7 |
Both have equal clean sheets and goals conceded which is quite remarkable. Maguire recorded 6 more blocks and 13 more interceptions, but Lindelöf had 9 more tackles and 10 more tackles won. Maguire was superior in the air however, with 77 headed clearances to Lindelöf’s 63 and 118 aerial battles won to 69. He also recorded 34 more clearances. Number of last man tackles was close, but Harry got 2 and Victor got 1.
ATTACKING
Lindelöf |
Maguire |
|
| Goals | 1 | 3 |
| Goals per Match | 0.03 | 0.10 |
| Minutes per Goal | 2,602 | 867 |
| Shots | 8 | 30 |
| Shots on Target | 1 | 13 |
| Shots off Target | 4 | 12 |
| Shooting Accuracy % | 20.00 | 52.00 |
| Goals (inside box) | 1 | 2 |
| Goals (outside box) | 0 | 1 |
| Offsides | 0 | 4 |
| Hit woodwork | 0 | 1 |
| Big chances scored | 1 | 1 |
| Big chances missed | 0 | 1 |
| SCORE | 3 | 9 |
Maguire provided more attacking threat for Leicester than Lindelöf did for United, as demonstrated by number of goal (3 to 1) shots (30 to 8) shots on target (1 to 13) and shooting accuracy with over 50% of all his shots being on target. Lindelöf had 20% shooting accuracy and 22 shots less than Maguire.
TEAMPLAY
Lindelöf |
Maguire |
|
| Assists | 1 | 0 |
| Big chances created | 4 | 1 |
| Passes | 1,490 | 1,747 |
| Pass Completion % | 89.19 | 85.58 |
| Passes forward | 556 | 685 |
| Passes Backward | 55 | 72 |
| Touches | 1,794 | 2,137 |
| Through balls | 1 | 2 |
| Crosses | 1 | 1 |
| Dispossessed | 3 | 7 |
| SCORE | 4 | 5 |
Lindelöf seemed to be more assured in possession than Maguire, as he was dispossessed 4 times less than Harry and possessed a better pass completion percentage (89.19 to 85.58). He also created more big chances (4) and recorded an assist. However not too much can be read into those stats as Maguire had over 250 more touches than Lindelöf and provided 2 through balls for his team to Lindelöf’s 1.
Conclusion: Who did it better?
Both players were very evenly matched pretty much all the way through. However it is clear that Maguire posed more of an attacking threat with a superior goals, shots on target and shot accuracy tally than Lindelöf. Victor may have seemed more composed as a centre half, winning more tackles and also creating more opportunities for his team but struggled to make an impact in the air, something United really struggled with this season. Maguire had no such issue, so I think dirty ‘Arry did it better this year in the league.
(Stats courtesy of http://www.premierleague.com)

Leave a comment